If the first thing that comes to mind when you see the letters SAR is Search & Rescue, helicopters, whatnot, then you are militarily inclined, may have been a member of armed forces, and/or played too many PC flight simulators, which is all good and fine. But it stands to logic, does it not, that a Linux system profiling designed to shed insight into system performance issues would be named the same way. SAR.
SAR actually stands for System Activity Report, but the basic premise is the same. You search for problems, and you fix (rescue) your box. Today, we will learn how to use SAR to make our Linux life easier. If you’ve read my Linux cool hacks compilations and closely followed the troubleshooting super tutorial, then you’re already familiar with the ins and outs of Linux system debugging. Let’s notch it up.
Taking off
SAR may or may not be installed on your system, depending on the distribution you use. I’ll leave the hunt for the right package to you. Assuming the program is there, then you should spend some times reading about SAR, because it’s quite complicated. There are many features. The program can be invoked manually, it can run in the background, with or without logging, and it can collect an impressive range of metrics, including the trivial memory, processor, disk, and network data, but also swap statistics, paging, faults, runqueue information, and more. You can even check RPC call and NFS values, and report a serial line transmit interrupts.
The basic invocation is very similar to iostat and vmstat, as we have already seen in my hacking tutorials. If you want to execute the tool on the command line, you specify a time interval and the number of runs. You can also use special flags to collect only specific data, like CPU or disk activity. This is quite useful if you’re trying to focus on a specific issue, without getting overwhelmed with unnecessary details.
sar 1 10
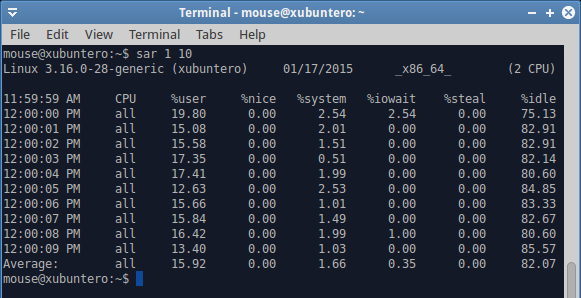
It gets more interesting when you can actually correlate your system to actual user activity. For instance, how does the CPU behave while watching a movie or downloading from the Internet? The output is very detailed, and going through every column and value is impossible. A rich man page should give you all the missing pieces. The important part is to understand the logic and core principles and then apply the right measurements at the right time.
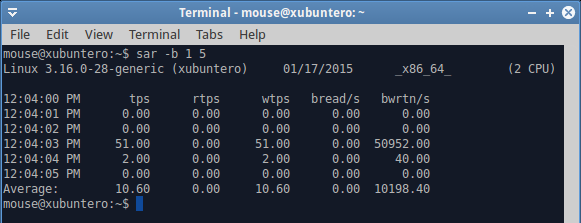
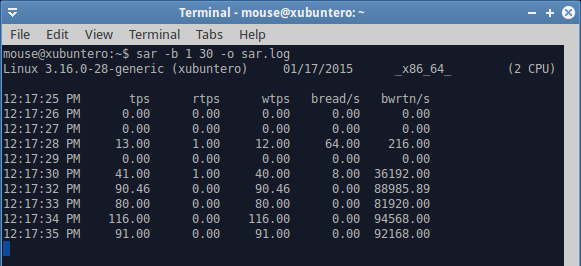
For most people, SAR will be most useful when they are experiencing slowness with their systems, which will almost inevitably stem from a hard disk bottleneck, usually due to a large amount of writes or swapping, and network activity with low throughput or high latency. In that case, running SAR with the -b option will shed more light on the number of blocks read and written. On their own, the metrics are not very helpful, but if you can interpret the data correctly, and you sort of know what your programs are supposed to be doing, you might be able to unravel all sorts of performance mystery and mischief.
Example
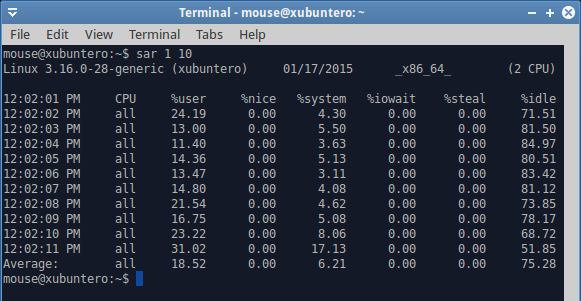
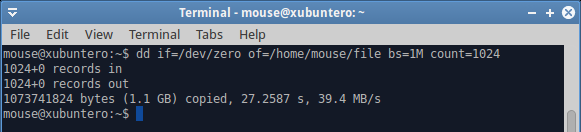
Let’s see what happens when we do a whole bunch of disk I/O. The simple way to simulate heavy load is by using the dd command. Now, it is important to remember that data is initially written to memory and only then flushed to disk. So there could be several phenomena affecting the system. The first could be swapping, if the memory policy is such to allow aggressive swapping, followed by actual write activity. Both of these will stem from a single source (dd), but the user will be impacted in a different way.
In this case, a user might experience a degradation in system responsiveness, which could happen if the system is busy swapping pages in and out. At this point, background processes will take time coming to life, and if you have multiple windows open, they could be sluggish, slow to switch, and more. Later on, the memory activity will cease, but the system will be busy writing actual dirty pages to the disk. You will get different results if you have mechanical hardware versus SSD. There could be extra slowness caused both by swapping and actual writes, both of which would impose a load on the I/O buffer. A user might think there ought not to be anything of that sort happening, because the download or copy or other disk data related activities have supposedly finished, and yet, they would continue to be impacted until the data is flushed and synced to persistent storage, and all the necessary pages swapped in. Now, let’s see what SAR tells us in this case.
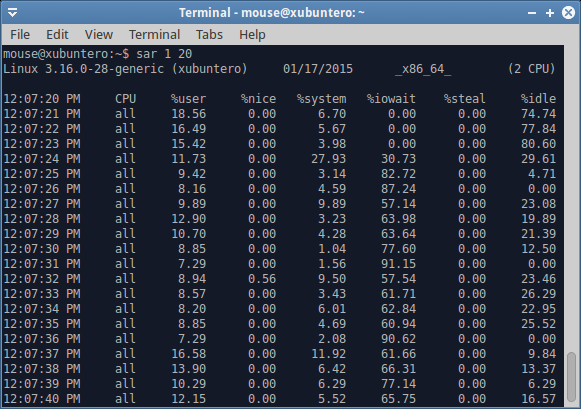
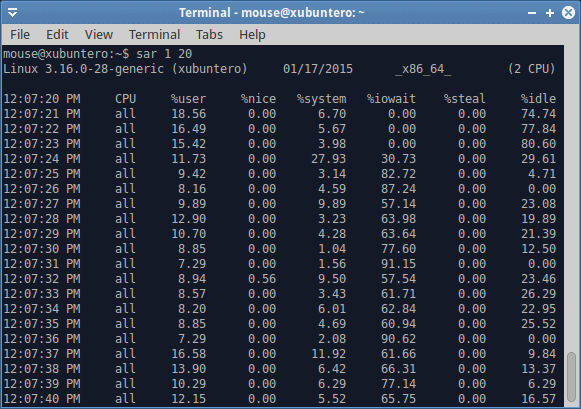
Disk activity begins on the fourth line, and we can see a sudden spike in %iowait, which means that we are waiting on the disk to complete its tasks. We know it’s a disk, because we’re doing dd. But it could also be a network related activity. Such high iowait values translate directly into user responsiveness penalty. And there’s swapping in the background, too. Do notice that the user CPU utilization drops as the I/O wait grows, and if you were to try to alt-tab your programs, move your mouse or such, you’d be lagging like mad. In general, I/O wait values that exceed 15-20% CPU indicate you do not have enough memory (cache) and fast enough storage to handle the necessary operation. This is typical of laptops, for instance, which is why you might encounter something like this when copying large files, streaming data or similar.
The dd command completed with an average write speed of 40 MB/s, which is pretty low for SSD. Again, this explains that the I/O buffer was not solely allocated to writes, but also included heavy swapping. You can test this on your hardware, writing larger and larger files with dd until you hit the point when there’s not enough physical memory to contain both the active pages for your running programs as well as the write cache.
Other metrics
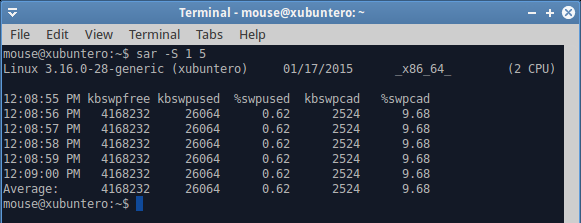
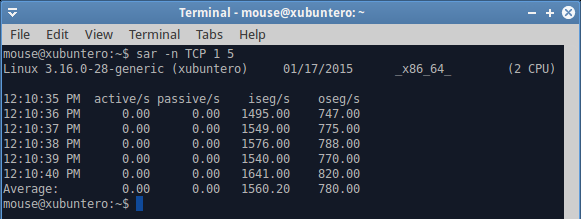
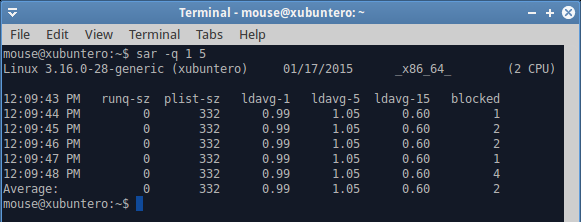
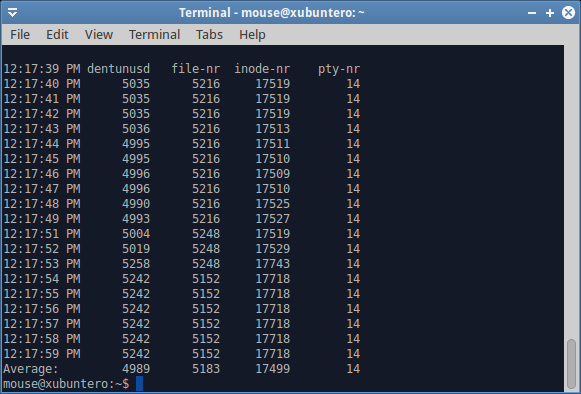
As I’ve mentioned earlier, SAR can collect pretty much anything. For instance, swap utilization. Or you might be interested in network values. Or maybe runqueue statistics. If we look at our dd example from earlier, then with very high IO wait values, you’d expect to see a large number of blocked processes. Indeed, you can verify this with the -q option. Again, the number of options and flags is virtually endless, and you will need to invest a lot of time learning how to use SAR to its full potential.
Logging
One of the more useful things about SAR is logging. Writing data to a logfile has many advantages. One, SAR logs are binary, so they are relatively small, and they contain a lot of stuff. Working on the command line and printing to standard output is only good if you are trying to narrow down a problem to a very specific metric. But you will be missing everything else. When you write to a logfile, all of the parameters will be collected, and you can then extract them using different flags. This allows you to analyze critical data offline, at your own leisure, and compare important metrics.
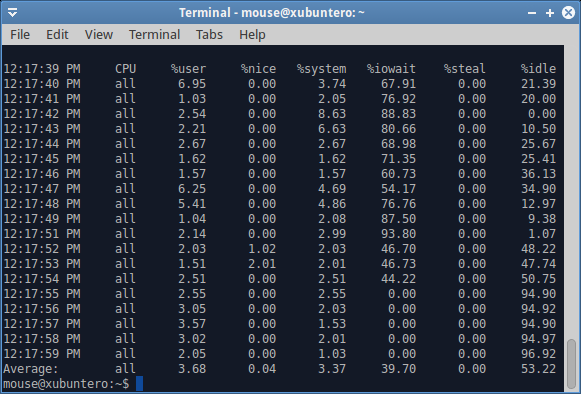
You can write to a log file with the -o flag, and read using the -f flag. Again, all the options remain, so if you want block data values, you can use the -b flag, and if you want CPU values, you will use the -u flag. This is extremely helpful to get additional views of info for your problem, correlate the different vectors and fix the issue.
Visual representation
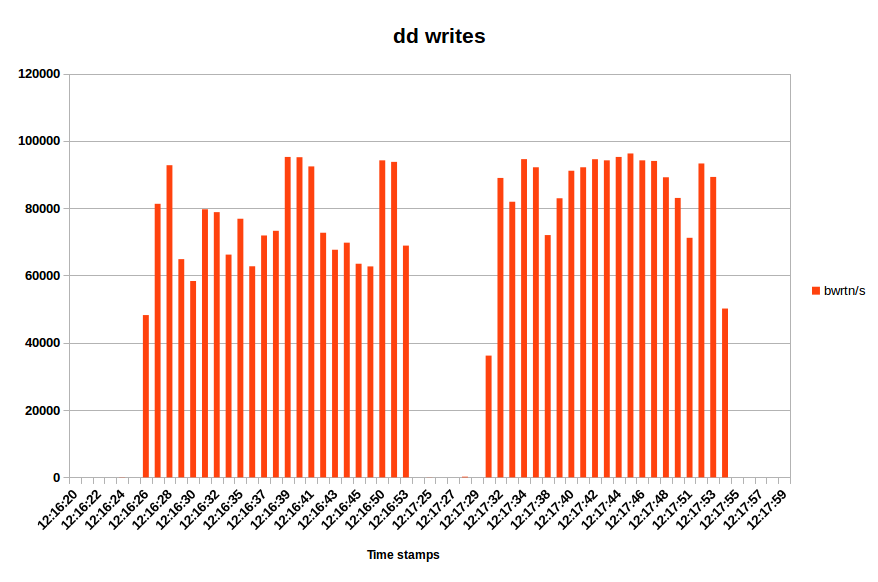
Sometimes, you might want to show system metrics in a nice graph. The SAR facility does not have an automatic way of doing that, but you can export data to files, or redirect the output. With txt or csv files and some kind of spreadsheet software, you will be able to visualize your system behavior. Going back to dd, we can see two distinct phases. The initial write takes about 27 seconds, then there’s a pause, followed by an additional 21 seconds of disk activity. This is exactly what I’ve mentioned earlier. The only question is, why is there a 30 second gap between the two? This is kind of a quiz thingie, and let’s see if you can figure it out in the comments section.
Conclusion
SAR is a very useful tool for serious home users, system administrators and professionals. It allows you to capture multiple views of your system behavior in rich detail, which can help you correlate between cause and effect to your problems and symptoms to your problems, which are not always easy to tell apart. On its own, SAR won’t do magic, and if you do not understand your software or system, you won’t make much progress.
However, if you are well versed in the art of basic troubleshooting, you have played with other system debugging tools, and you are comfortable working on the command line, then you can make very good use of SAR. You can script and cron it, and then raise exceptions and alerts when problems occur. In the home environment, you will be less interested in continuous background monitoring, but you might want to use SAR when you Linux exhibits wonky behavior. And when it comes to fixing wonkiness, there are few tools as handy and versatile as SAR. And this brings us to the end of our guide, and make sure you answer the quiz question, now will you? There.
Cheers.
[sharedaddy]


The pause is the 5 seconds delay related to ‘/proc/sys/vm/dirty_writeback_centisecs’ default setting.
Or the ‘/proc/sys/vm/dirty_expire_centisecs’ setting.
Interesting, let’s see if there are any other suggestions 🙂
Dedoimedo
Nice writeup but seen more in depth articles on it. As getting confused with last few months mostly general linux and non-KDE or Netrunner posts. Which surprises me as thought this was a blog about KDE and Netrunner as the title indicates. Last couple of weeks been many new happenings in KDE and Plasma 5. But we get a generic linux post? And zero peeps on KDE or Netrunner.
Sorry tried to find a more private way to make comment on my concerns but no contact links for private messages. As just my opinion that this site isn’t specific enough to KDE and Netrunner News Stories and Info. I know it says GNU/Linux also at the end of the about page. But seems content is more general linux then focusing on KDE and Netrunner.
As I can get any general Linux from many other sources. I was hoping this site would be more focus to KDE and Netrunner.
Thanks again and sorry with no other means to contact contributors.
Well, the about page says:
“Netrunner MAG is published by Blue Systems. It covers news and articles around Netrunner, KDE and GNU/Linux in general.”
So there’s a bit of everything.
Regards,
Dedoimedo